Awards 2012
Best In Show (most popular vote by all judges)
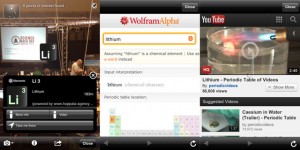
Hack: The Elements Trail
Creators: Concept, development @brian9 and Icon design @emma_wade
An augmented reality treasure hunt based on the Periodic Table of the Elements. Exercise, education and technology.
The Government Data Award (best use of scientific data provided by a government agency).
Sponsored by Fingal Open Data
Hack: Youth Physical Activity Towards Health (Y-PATH) Online Progress Report Tool
Creators: Wesley O’ Brien and @alanmrice
The purpose of this hack was to create an online tool for students to record how much physical activity they do on a daily or weekly basis. While many of these types online physical activity trackers do exist, there does not appear to be any school based online resources particularly for physical education. This tool is designed to be rolled out in the Irish education system in time.
The Data Award (most interesting use of data)
Sponsored by Cartrawler
Hack: Financial Market Sonification
Creators: Daniel Hartnett, Jack Higgins, Arijit Das
Presenting live financial market data in an audio format to alert a trader to different market conditions
The Hardware Award (best hardware based hack)
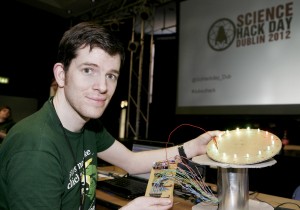
Hack: Aurora Lamp
Creators: Robert Fitzsimons @PartFusion Connor David Laura and others
As inspired by the Aurora Orrery project on the wiki Robert under took to create a device that would try and recreate an Aurora on a globe using RGB LEDs.
The Design Award (best overall design)
Sponsored by SIG
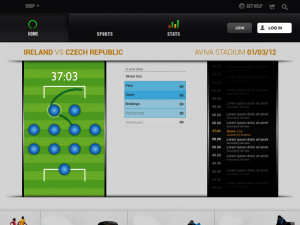
Hack: Open Stats Wiki
Creators: Joseph McCarthy @tetsujin1979, Kevin Sexton @sextonireland and James Keane @level71
Recording events from a game to be used later in statistical analysis to show, for example, when each pass, shot, booking, etc was made, and then making the data available for public to use, and edit to correct. Since Science Hack Day 2012 “Open Stats Wiki” has turned into Mobstats and the team can be seen kicking ass and taking names around the NCRC.
The People’s Choice Award
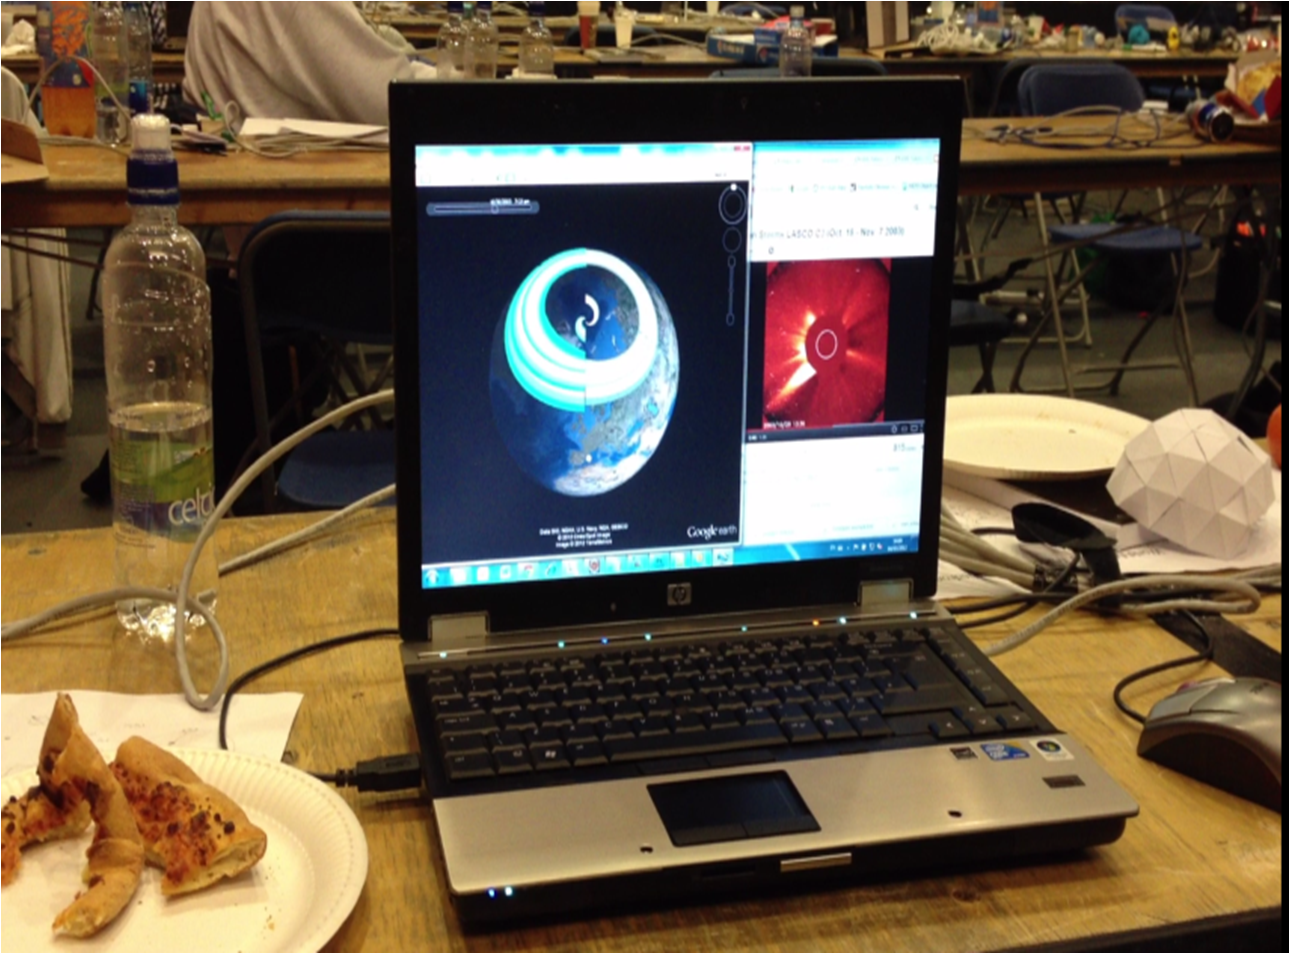
Hack: Aurora Orrery
Creators: David Pérez-Suárez Connor Upton Neil Kelly Marisa llorens Colin McSwiggen
The Aurora Borealis or Northern Lights are a natural light display in the sky particularly in the high latitude regions, caused by the collision of energetic charged particles with atoms in the high altitude atmosphere. Because the sun is now entering a more active part of its solar cycle, the next few months and years are expected to see more frequent solar storms. Recent storms have had higher intensity making it possible to see this phenomenon from lower latitudes, even from Ireland.
– ‘We’d like to build an Aurora Map that can be used to show when solar storms are intense enough to be seen from Northern Ireland. If we can we’d like to integrate weather and moon data to help me decide whether to travel or not. we’d also like this to be an ambient display in the form of a physical map or globe with integrated lighting so that it’s entertaining’
1. Get the data into google maps as a series of animated polygons
2. Build a flat map of the arctic with an underlay of LEDs
3. Build a 3D global model with LEDs


Congratulations to all participants. I think this was like a marathon and anyone who managed to stay until the end deserves a medal.